
3. Component reliability, Part 2#
Task 0: Tasks to complete during the workshop are provided in boxes like this.
Explanations in the solution are provided in boxes like this.
In this workshop, we will perform a reliability analysis of a hydraulic engineering problem: the reliability sea dike against wave overtopping. You can see videos of this process here! If the overtopping discharge is too great, or occurs for too long, the dike will erode and lead to flooding of the polder. This is not good, so we try and prevent it by making sure the probability of exceeding the overtopping capacity of the dike is small. We perform the analysis using the van der Meer equation, which calculates discharge [L/m/s] based on wave characteristics and freeboard, the vertical distance between the top of the dike and the still water level (the water level not considering waves).
The hydraulic boundary conditions are important for this calculation, because in coastal environments there are two main loads to consider: waves and wind setup. Waves are defined by their significant wave height and period, and are generated by a strong wind blowing over a large distance (the fetch). Wind setup occurs in shallow areas, where the wind “pushes” water up against the shore, causing an increase in the still water level. Both of these loads are dependent on the wind speed and water depth. We calculate waves using the Brettschneider equations, and setup using a simple 1D model. In summary the calculation process is as follows:
estimate: dike crest height, average elevation of the sea bottom offshore of the dike (the foreshore), still water level due to tides
estimate the wind speed, ideally using a probability distribution (extreme value!)
calculate the wave conditions
calculate the wind setup
calculate the overtopping discharge
This has been implemented in the function overtopping_discharge in the attached file utilities.py. Some preliminary work has already been done for you by defining the design values for some of the parameters in the equations. Your task is to calculate and interpret the reliability of the dike against overtopping by setting up a MCS and FORM analysis using the following random variables:
Variable |
Name |
Marginal distribution |
Mean |
c.o.v |
|---|---|---|---|---|
\(ob\) |
Bottom elevation [m+NAP] |
Normal |
-2.0 |
0.15 |
\(h\) |
Water surface elevation [m+NAP] |
Normal |
+2.0 |
0.10 |
\(u_{10}\) |
Wind speed [m/s] |
|
15.1 |
0.48 |
Note that you should define the WeibullMin distribution as WeibullMin(17, 2.2) using OpenTURNS (the inputs are the shape and scale parameters).the water surface elevation assumes a high tide situation, and the normal distribution represents the variability in high tide elevation observed throughout the year.
We know that there are two main hydraulic loads, caused by the wind, which govern overtopping discharge: wind setup and waves. Both of these are also dependent on the water depth, \(d=h-ob\).The figure below illustrates the magnitude of each, as a function of the water depth for the 95th percentile wind speed.
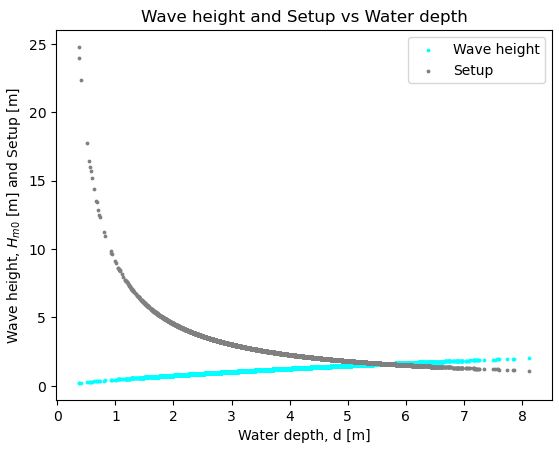
We can see that both effects have opposite relationships to water depth. Since both effects are also proportional to the overtopping discharge, it becomes difficult to establish what the “critical case” is to use in our dike design. Probabilistic methods can help us (by integrating across all combinations of loads), but in the end we still need to determine one set of design values which we will use to actually build the dike (in this case, freeboard). Finding an answer to this question and understanding the role of uncertainty in the solution is one of the main themes of this workshop.
Note
This page is generated from an *.ipynb file and is accompanied by a *.py file, all of which can be downloaded using the link below.
Task 1: There are at least two critical cases to consider for this problem. Imagine you are performing a deterministic analysis (but are still acknowledging that a few variables are random). List at least two design cases (qualitatively) and describe how you might select the load values to use in your overtopping calculation. Justify your decision.
Answer here.
Now let’s get our Python packages set up.
import numpy as np
import matplotlib.pyplot as plt
import matplotlib.cm as cm
from scipy.optimize import fsolve # for plotting the LSF
The reliability analyses (FORM and MCS) will be performed using OpenTURNS. Remember, there is a tutorial in the Probabilistic Design chapter of the HOS online textbook.
import openturns as ot
import openturns.viewer as viewer
ot.Log.Show(ot.Log.NONE)
We also have a few custom methods in utilities.py:
from utilities import *
overtopping_discharge?
Task 2: Define the three random variables as OpenTURNS distributions, then check whether you can evaluate the limit-state function properly by evaluating the overtopping discharge at the 90th percentile value of each random variable. Based only on this calculation, what do you think the probability of exceedance is for this overtopping discharge?
Task 3: Define the limit-state function (incorporating the maximum allowable discharge of $q=1$ [L/m/s]), multivariate probability distribution and set up the OpenTURNS analysis and solve the reliability problem using MCS and FORM.
Task 4: Interpret the reliability analyses. Be sure to consider: pf, beta, the design point in the x and u space, linearity of the limit-state function, importance and sensitivity.
Answer here (you may need to print a few more analysis results).