
4. Threshold & Declustering#
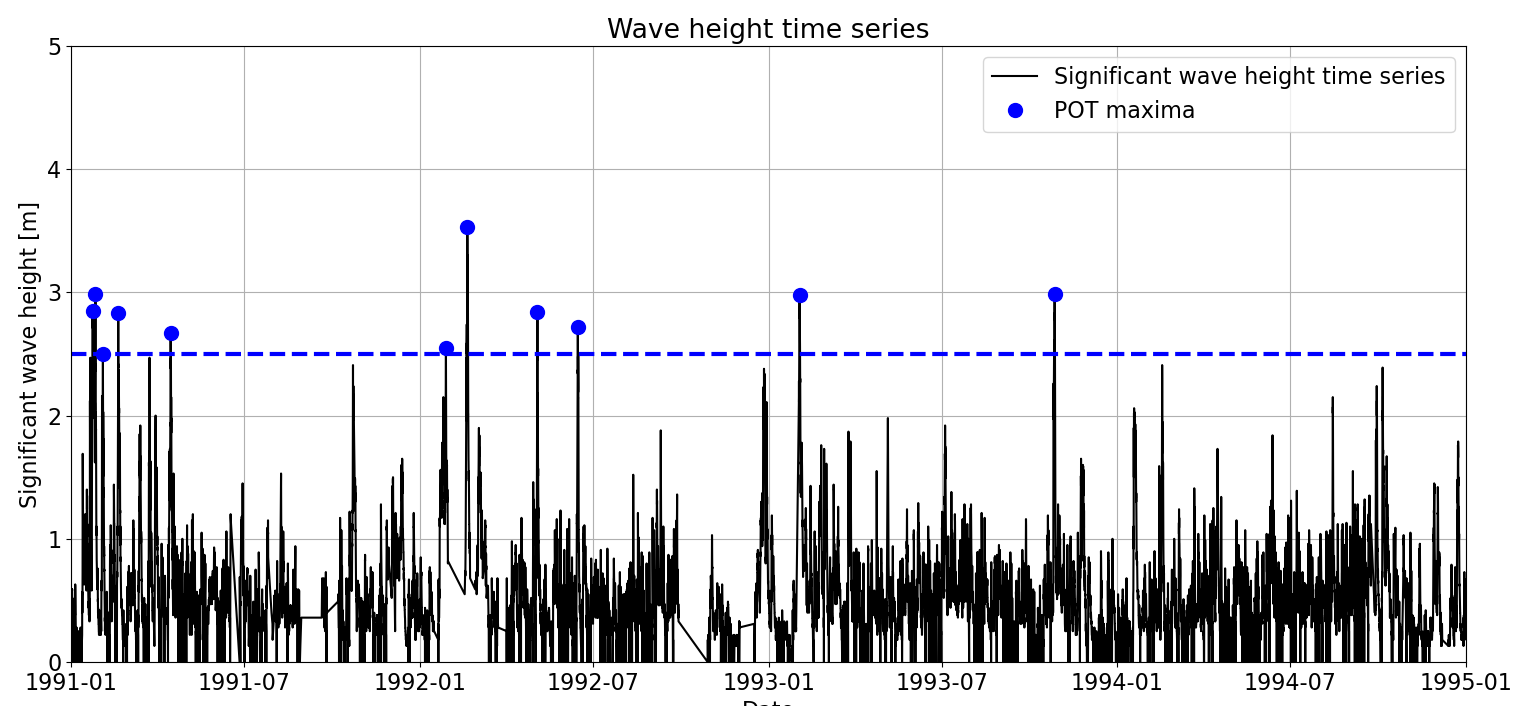
In the previous chapter, we saw the Peak Over Threshold (POT) technique to sample extremes and we applied it to our time seres. We used a threshold \(th = 2.5m\) and a declustering time \(dl = 48h\), obtaining the figure below. However, no justification was given for those parameters. In this section, we will start giving insight on how to select \(th\) and \(dl\), which is inherently a verification and validation process for our chosen distribution.
We also discussed previously that extreme observations tend to cluster in time and, thus, we need to ensure that only one extreme observation is sampled within each cluster to guarantee our assumption of iid observations. Thus, threshold and declustering time should be selected accounting for it. In addition, the concept of Poisson process and its relationship with EVA was introduced. It was concluded that by ensuring that the number of excesses per year followed a Poisson distribution, the sampled extremes were iid.
There are several techniques in the literature to support the decision-making process of selecting \(th\) and \(dl\) for POT. Here, we will start with the basic one (application of properties of Poisson distribution and hypothesis testing to check whether the number of excesses per year follows a Poisson distribution) which is the underlying assumption below the more complex techniques that we will see in subsequent sections.