
1.3. Sampling Techniques#
Why do we need sampling techniques for extremes?
In the previous sections, you have seen the basic concepts needed to address Extreme Value Analysis (EVA), such as what is an extreme observation or the return period (\(RT\)). Here, we will start the former EVA by presenting the sampling techniques for extremes. In order to illustrate it, we will use a case study: a breakwater design.
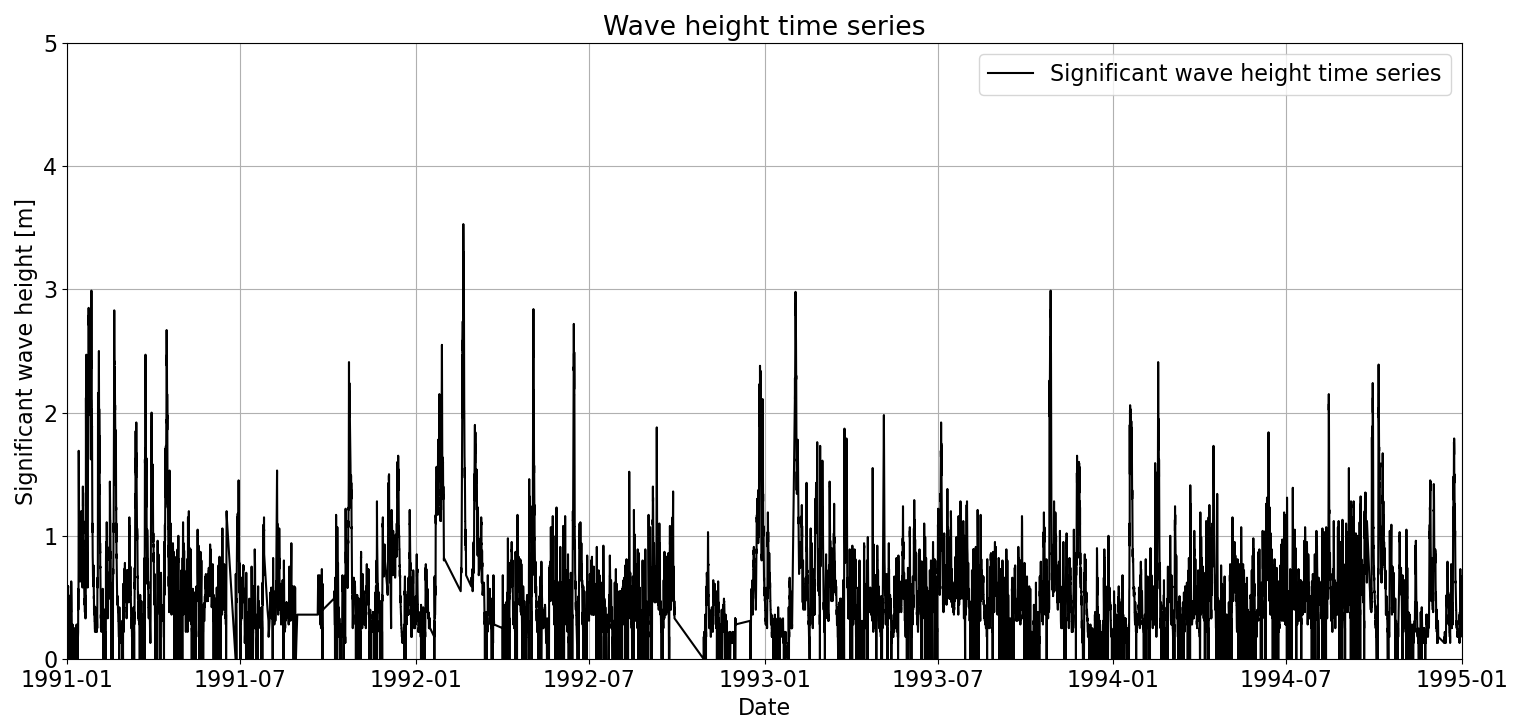
Breakwaters are structures which protect the basins of ports and have to withstand wave storms. Thus, the main loading is the significant wave height (\(H_s\)) and we need to determine \(H_s\) for a given \(RT\), for instance \(RT = 100\ years\). For our case of study, we are going to use a time series of \(H_s\) recorded by a buoy in the Mediterranean sea. In such buoy, we have 20 years of hourly recordings. In the image below, four of those years are plotted.
How can I select the extreme observations within my timeseries?#
Once we have the time series, the question arises: which values should I use for my analysis? Not all of them are extremes, so I need to extract them from my historical data.
To this end, we can use two sampling techniques:
Block Maxima (BM)
Peak Over Threshold (POT)