Calibration score#
Given that 3 quantiles are elicited, the realizations of the calibration questions should fall on one of the 4 inter-quantile intervals with probability vector \(p = (0.05, 0.45, 0.45, 0.05)\).
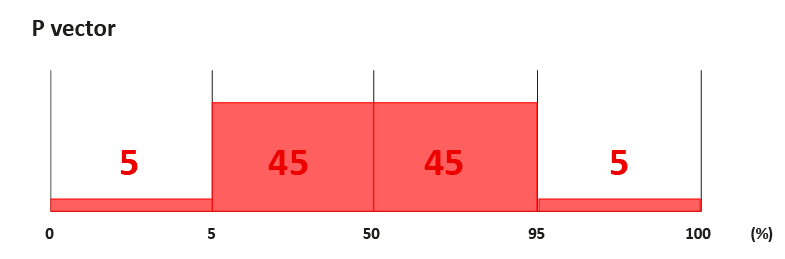
Fig. 82 P-vector#
This probability vector can be compared with the sample distribution of the expert’s inter-quantile intervals \(s(e)\) computed as
\( s_1(e) = \#\{i|x_i \leq 5\% \ quantile\}/N \\ \)
\( s_2(e) = \#\{i|5\% < x_i \leq 50\% \ quantile\}/N \\ \)
\( s_3(e) = \#\{i|50\% < x_i \leq 95\% \ quantile\}/N \\ \)
\( s_4(e) = \#\{i|95\% < x_i \ quantile\}/N \\ \)
\( s(e) = (s_1, s_2, s_3, s_4) \)
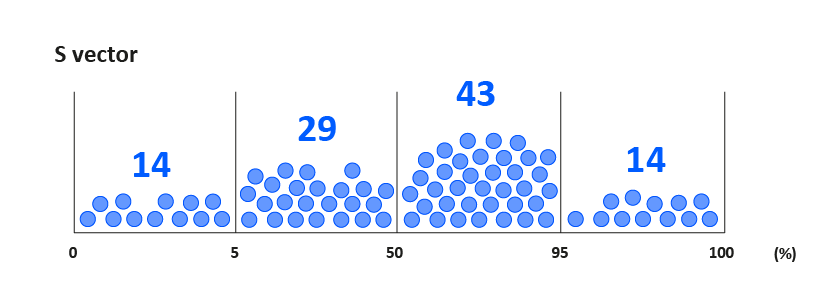
Fig. 83 Example of an empirical s(e).#
Note that \(s(e)\) is computed per expert. The calibration score of each expert \(Cal(e)\) can be then computed to assess the discrepancy between \(p\) and \(s(e)\) as
where \(n\) is the number of calibration questions. Low scores of \(Cal(e)\) mean that the expert’s assessment is unlikely to be statistically accurate.
Let’s see it with an example#
Let’s compute the calibration score for expert E using the 8 seed questions in Fig. 84.
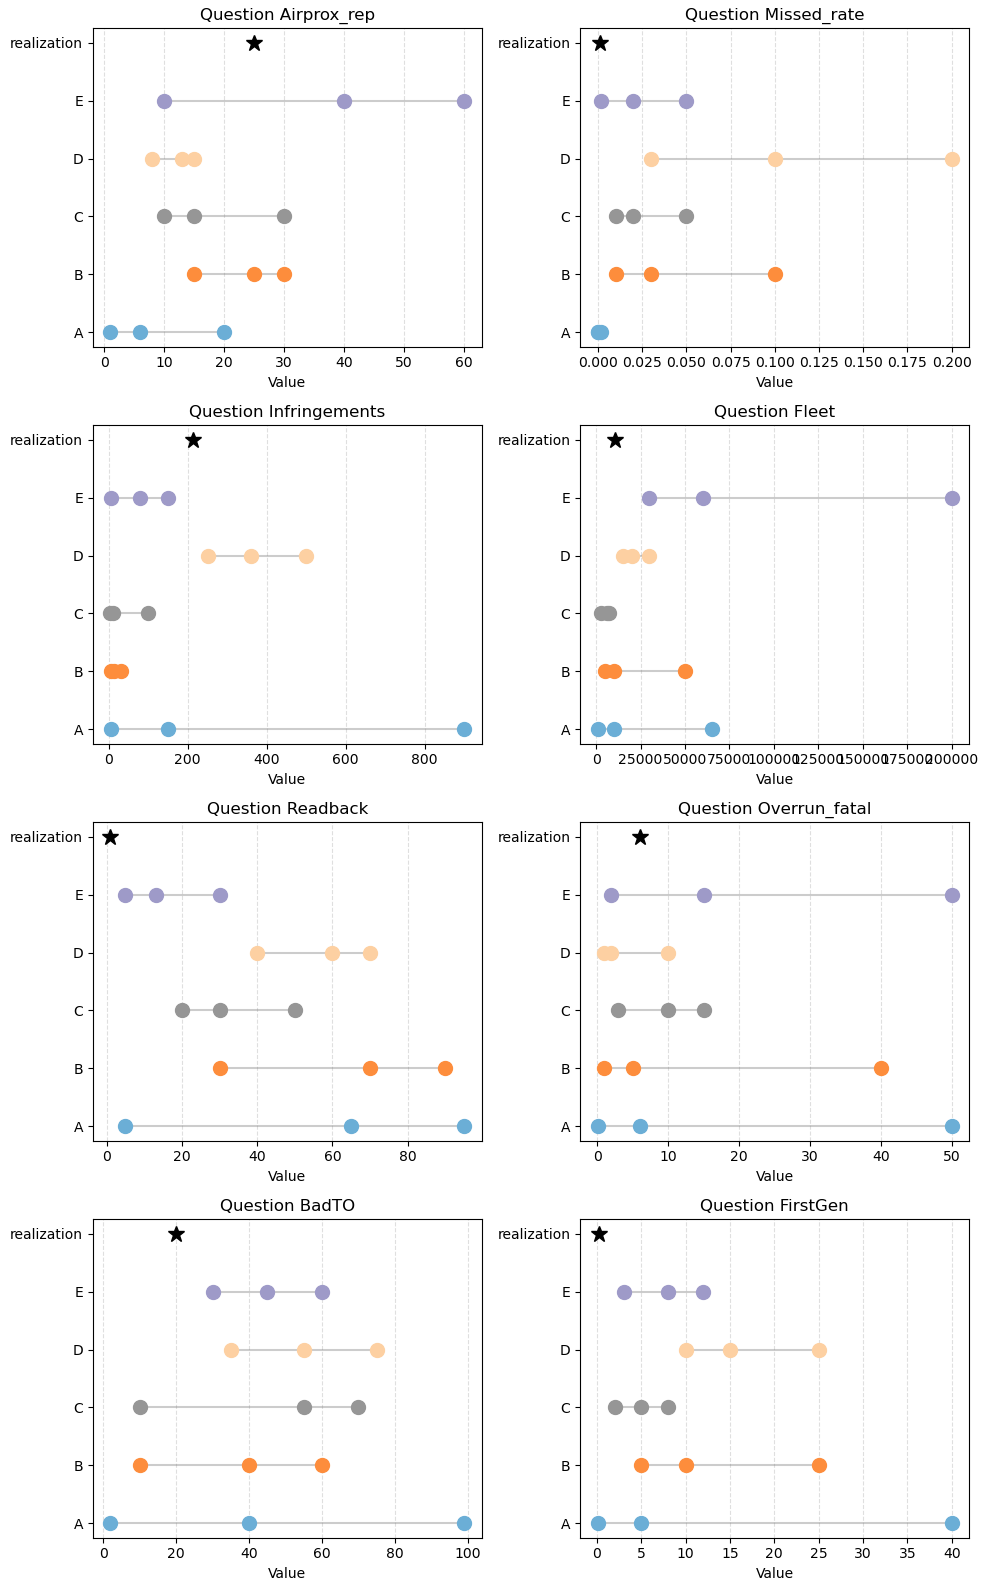
Fig. 84 Example of 4 seed questions with 5 experts (A, B, C, D, E). Each panel represents a seed question. The dots represent the 5th, 50th and 95th percentiles given by the expert.#
First, we compute the \(s(E)\) by counting the number of times that the realization falls in a given interquantile range. We obtain
Using \(s(E)\), we can compute \(I(s,p)\) as
And finally the calibration score for expert E, \(Cal(E)\) as
Therefore, expert E has a very low calibration score.
It’s your turn now!#
Compute the calibration score for expert A. Which expert is more calibrated when comparing expert A and E? Note that the realization in the top right panel falls in the third interquantile range.
Solution
First, we compute the \(s(A)\) by counting the number of times that the realization falls in a given interquantile range. We obtain
Using \(s(A)\), we can compute \(I(s,p)\) as
And finally the calibration score for expert A, \(Cal(A)\) as
Cal(A) = 0.73 >> Cal(E)=0.00027. Therefore, expert A is much more accurate than expert E.
Note that with 8 calibration question is impossible to get a vector \(s\) that perfectly matches the vector \(p\).
.