
Exponential distribution#
1. Theory#
The exponential distribution is the probability distribution of the time between successive events of a Poisson process. The distribution is applicable for other variables such as length and space in addition to time.
The exponential distribution for a continuous random variable is defined by the PDF
\( f(x)=\lambda \mathrm{exp}(-\lambda x) \quad \mathrm{for} \: x\geq 0, \: \lambda > 0 \)
For the same conditions, the Cumulative distribution function (CDF) is:
\(F(x) = 1- \mathrm{exp}(-\lambda x)\)
The mean or expected value of of the exponential distribution is given by:
\( E\left [ X \right ] = \frac{1}{\lambda }\)
For the Poisson process, \(\lambda\) is the rate at which events occur, whereas \(\frac{1}{\lambda}\) is the average time between events. In reliability analysis, it is often referred to as the mean life time or time to failure.
Hence, the variance is:
\(\mathrm{Var}\left [ X \right ] = \frac{1}{\lambda^{2} }\)
2. Dam construction safety#

A contractor is building a dam and river diversion is key to construction safety. The contractor is concerned about the possible occurrence of a flood exceeding 120 \(m^{3}/s\) which can interrupt the construction. According to the records, a flow of such magnitude is exceeded once in 10 years on average. Assuming that the floods exceeding events are independent, identically distributed, and can be modelled with an exponential distribution. The contractor would like to know:
What is the probability density function that describes the years between floods exceeding events?
What is the chance that the construction will suffer interruptions in the first 2 years?
The construction of the bridge is scheduled to last 5 years. What is the probability that the work can be done without interruption because of the possible occurrence of a flood exceeding?
1. What is the probability density function that describes the years between floods exceeding events?
The estimated mean time interval between flood events is 10 years. Hence, \(\lambda = 1/10 = 0.1\)
If we let the random variable \(X\) be the number of years between flood exceeding events. Then the PDF is:
\(f(x) = 0.1 e^{-0.1 x}\)
The plot of the PDF can be generated with the following script
import numpy as np #import numpy library to use exponential function
import matplotlib.pyplot as plt #matplotlib is a library for creating visualizations in Python

Lambda = 1/10

plt.rcParams.update({'font.size':16})   # minimum font size is 16
plt.figure(figsize=(8,4))               # the figure size is 8 inches x 4 inches
x = np.arange(0,40)                     # Array of evenly spaced values
#plot of the pdf
plt.plot(x,Lambda*np.exp(-Lambda*x),
        label = f'$\lambda e^{{- \lambda x}}$, $\lambda$ = {Lambda}') #label adds a legend in the plot
plt.xlabel('Years')                     #label of the x axis
plt.ylabel('f(x)')                      #label of the y axis
plt.xlim([0,40])                        #limit of the x axis
plt.legend()                            #place the legend on the plot
plt.grid('--',which='both',color='gray',alpha=.2)  #configure the grid lines
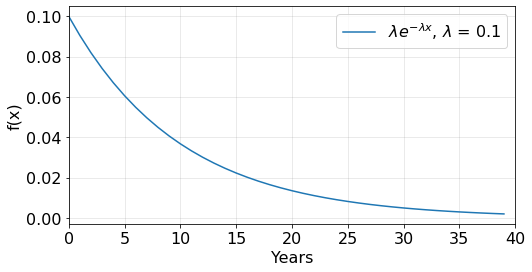
The figure above shows the probability density function that describes the years between floods exceeding events.
2. What is the chance that the construction will suffer interruptions in the first 2 years?
The estimated mean time interval between flood events is 10 years. Hence, \(\lambda = 1/10 = 0.1 \)
Then, we’re asked to solve for \(x \leq 2\). Therefore we need to use the CDF of the exponential distribution \(P(X \leq x) = 1 - e^{-\lambda x}\)
\( P(X \leq 2) = 1 - e^{-0.1 (2)}= 0.181\)
Therefore, the probability that the construction will suffer interruptions in the first 2 years is 18.1%
We can easily obtain the solution using the following Python script:
import numpy as np #import numpy library to use exponential function
Lambda = 1/10
x = 2
probability  =  1-np.exp(-Lambda*x)

#display the result rounded to three decimal places
print(f'The probability is {probability:.3f}')
The probability is 0.181
The figure bellow shows the graphical result.

3. The construction of the bridge is scheduled to last 5 years. What is the probability that the work can be done without interruption because of the possible occurrence of a flood exceeding?
The estimated mean time interval between flood events is 10 years. Hence, \(\lambda = 1/10 = 0.1\)
Then, we’re asked to solve for \(x > 5\). This means that we need to apply 1 - CDF of the exponential distribution as follows:
\( P(X > x) = 1 - P(X \leq x) = 1- (1 - e^{-\lambda x})\)
\(P(X > 5) = 1- (1 - e^{-0.1 (5)})= 0.368\)
Therefore, the probability that the work can be done without interruption is 36.8%
We can easily obtain the solution using the following Python script:
import numpy as np #import numpy library to use exponential function
Lambda = 1/10
x = 10
probability  =  1-(1-np.exp(-Lambda*x))

#display the result rounded to three decimal places
print(f'The probability is {probability:.3f}')
The probability is 0.368
3. Time interval between two subsequent earthquakes#
We will model the time interval between two subsequent earthquakes as an exponentially distributed random variable. The figure below shows the pdf of the time interval \(X_A\) and \(X_B\) in countries A and B, respectively.

Please answer the following:
Important!
Answer all questions in two decimal places.
Determine whether each statement is TRUE or FALSE