Total Probability Theorem#
1. Theory#
In this module, we will see a key theorem in probability: the total probability theorem. The importance of this theorem arises when the probability of an event cannot be calculated directly, but its occurrence is related to the occurrence of other events. We will apply it later to a water resources problem (to save the tulips!).
Consider a set of mutually exclusive, collectively exhaustive events, denoted \(B_i\), where \(i=1, 2,…, n\).
Side note: do you not remember the concepts of mutually exclusive or collectively exhaustive? Go back to the “Must-know probability concepts module!”
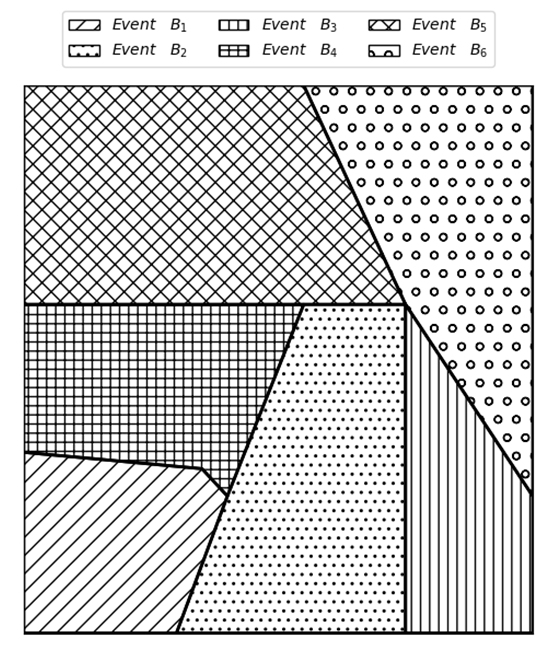
The figure above shows how the sample space is made up of all the possible outcomes related to \(B_i\). Let’s consider another event \(A\), which is illustrated in the following figure by the red rectangle. We can see that there are several different outcomes for \(B_i\) that can occur when \(A\) has occurred. We can also see that the probability of the other event \(A\) can be obtained through this set as:
\(P(A) = P(AB_1)+P(AB_2)+…+P(AB_n) = \sum_{i=1}^{n}P(AB_i)\)
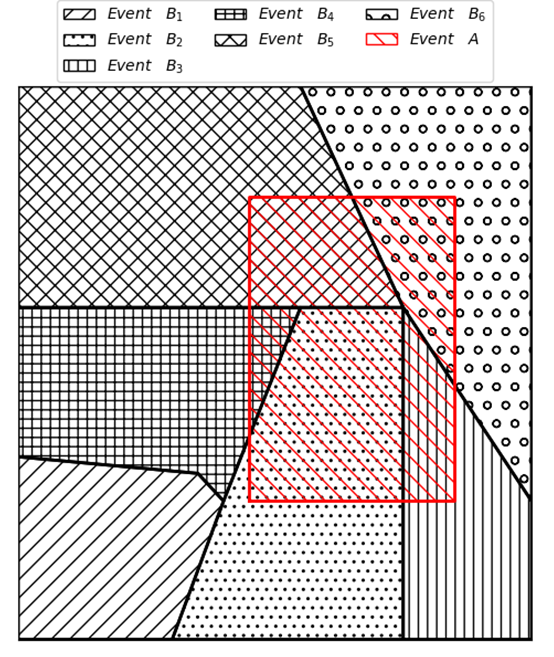
The definition of conditional probability can be used to represent each of the areas where \(B_i\) and \(A\) overlap:
\(P(AB_i)=P(A|B_i)P(B_i)\)
This allows us to re-write the previous expression for \(P(A)\):
\(P(A) = \sum_{i=1}^{n}P(A|B_i)P(B_i)\)
Which is the Total Probability Theorem!
2. Tulip fields#

Tulip fields are one of the major touristic attractions in an area in South Holland, as well as an important source of income. Thus, the Public Authority in the area wants to know how vulnerable those fields are. Would you help them calculate the probability of the tulips being damaged in a given year, \( P(A)\)? Fortunately, you have already been provided historical data from which you can derive probabilities of bad events happening, \(P(B_i)\), as well as the probability that such an event leads to damage, \(P(A|B_i)\), which are summarized below.
First, there may be a regional drought with a probability \( P(B_1)=0.05\) or a pipe in the supply system may break with a probability \(P(B_2)=0.10\). There is a chance of \(P(A|B_1)=0.65\) and \(P(A|B_2)=0.55\) that tulips won’t grow if the regional drought or the pipe breakage happens, respectively.
There may also be a human error in the operation of the water supply system, \(P(B_3)=0.03\), which may make tulips be too dry or too wet and results in rotten tulips with a probability \(P(A|B_3)=0.90\).
Another possibility is that the stored water to ensure the supply may get polluted, \(P(B_4)=0.05\), leading to a lack of water for the tulips with a chance of \(P(A|B_4)=0.70\).
Also, catastrophes can happen! There may be a plague or a fire that occurs with probabilities \(P(B_5)=0.03\) and \(P(B_6)=0.05\), respectively. Those can lead to damage in the tulips field with probabilities \(P(A|B_5)=0.80\) and \(P(A|B_6)=0.90\).
Find a summary below.

1. Assuming that the described events are independent, mutually exclusive, and collectively exhaustive, apply the Total Probability Theorem to calculate the probability of tulips being damaged in one year, P(A).
You can write out the total probability rule by hand, but often it is useful to keep track of all the individual events in a table:
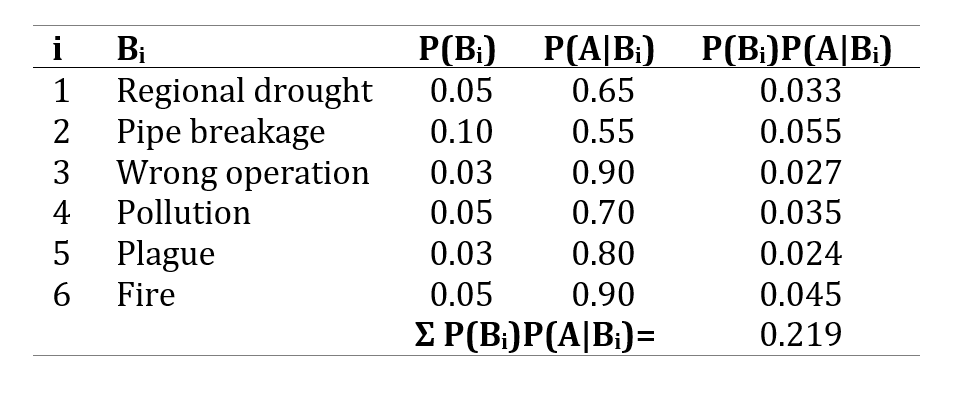
Therefore the probability of tulips being damaged in one year is 0.219
2. Considering the values in the table bellow, which of the following actions should the Public Authority take first?
a). Improve the maintenance of the pipes in the supply system
b). Further automate the operation to prevent human errors
c). Improve safety protocols to prevent fire
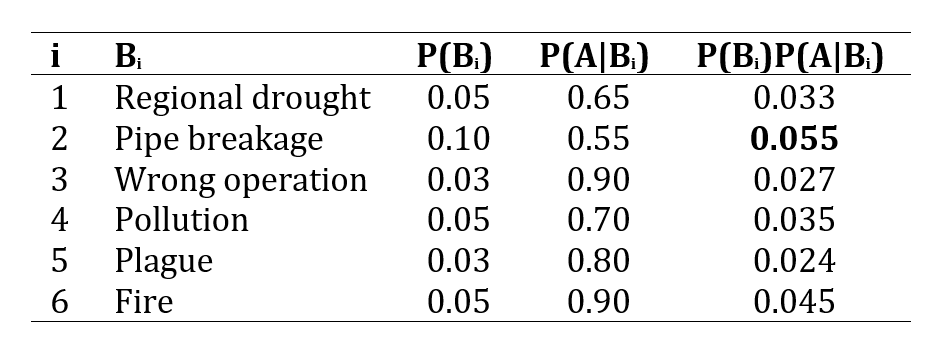
By looking at the values in the table we can say that the answer is “a) Improve the maintenance of the pipes in the supply system.”
This is because the cause which contributes the most to the damages in the fields is the pipe breakage in the supply system. Thus, improving their maintenance may be one way to reduce \(P(B_2)\). We could also try to reduce the value of \(P(A|B_2)\). Since this value is conditional on broken pipes, it obviously is a function of what happens at the tulip farm after the pipe breaks. For example, a leaky pipe detection system, or a backup water delivery system. If we can address those parts of the entire tulip growing system we can effectively reduce the overall probability of tulip damage.
3. Concrete compressive strength#
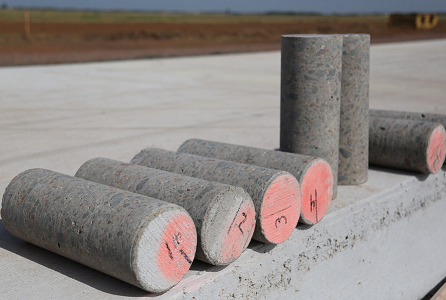
Table 1 shows the concrete compressive strength of 60 concrete core samples (\( f_{c}^{'}\), in \( \mathrm{MPa} \)) taken in different buildings. The sample space can be represented by the foregoing mutually exclusive, collectively exhaustive events \( \mathrm{B1} \), \( \mathrm{B2} \), \( \mathrm{B3} \), and \( \mathrm{B4} \), where:
\( \mathrm{B1} \equiv \left \{11.57 \leq f_{c}^{'} < 18.78 \, \mathrm{MPa} \right \}\)
\( \mathrm{B2} \equiv \left \{18.78 \leq f_{c}^{'} < 26.00 \, \mathrm{MPa} \right \}\)
\( \mathrm{B3} \equiv \left \{26.00 \leq f_{c}^{'} < 33.21 \, \mathrm{MPa} \right \}\)
\( \mathrm{B4} \equiv \left \{ f_{c}^{'} \geq 33.21 \, \mathrm{MPa} \right \}\)
Suppose an engineer is interested in estimating the probability that the concrete compressive strength ranges from 20 to 30 \(\mathrm{MPa} \), that is, the event:
\( \mathrm{A} \equiv \left \{20 \leq f_{c}^{'} < 30\, \mathrm{MPa} \right \}\)
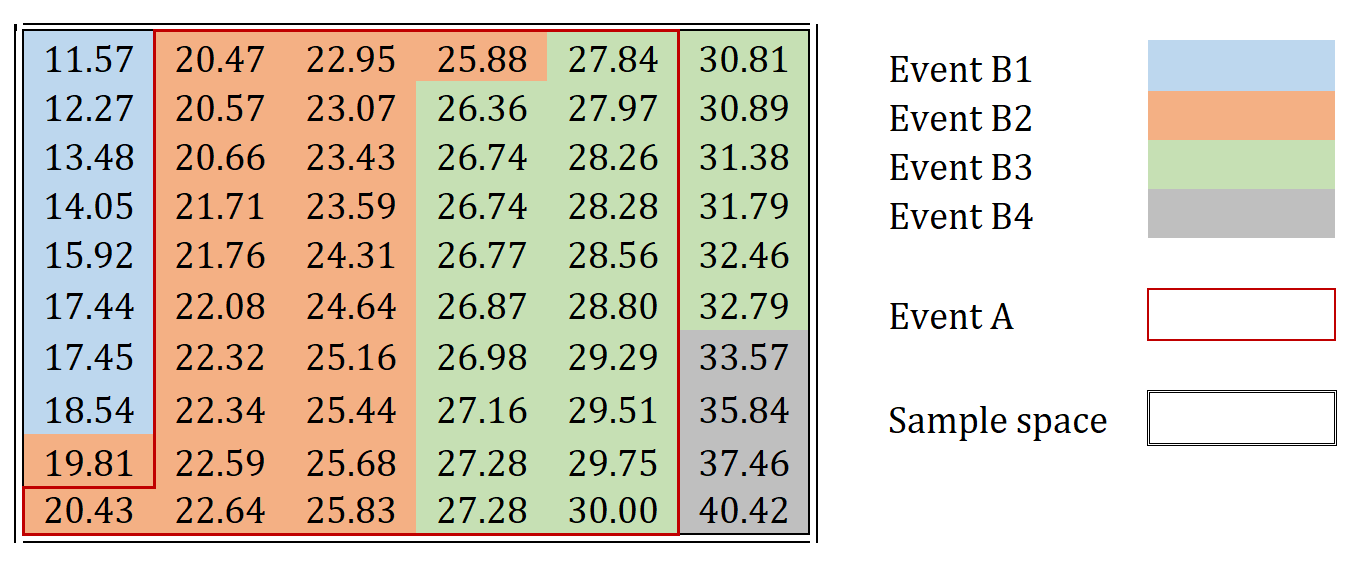
Table 1. Ranked concrete compressive strength data for concrete core samples in \(\mathrm{MPa}\), in ascending order
The frequency distribution is given in the following table:
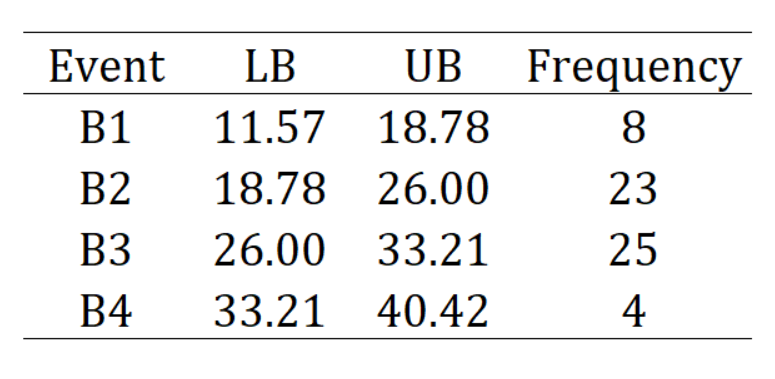
Please answer the following questions:
Hint
Check how many values fall between 20 MPa and 30 MPa in table 1. Give the answer in three decimal places.
