
Must-know probability concepts#
Welcome to the Must-know probability concepts module, which covers key concepts from probability theory needed to go further in your probability journey in Civil Engineering & Geoscience (CEG) applications. This module is different than the others in this course since it lists many small concepts rather than focuses on one. This is because many of them should have been covered in a high school and bachelor-level course on statistics. Since there are many excellent textbooks and videos on the subject, you should refer elsewhere if these concepts are completely unclear to you.
Event and sample space#
Sample space (\(\Omega\)) is the collection of all possible outcomes arising from an experiment or operation which involves chance. An event is the specific outcome, or set of outcomes, from the experiment or operation. Many natural disasters can be considered as binary events: either they occur or don’t occur. This is analogous to flipping a coin, where the ‘flip’ is our experiment and heads or tails define the two possible events. Our sample space is the set of two possible events.
For natural disasters, we often consider a specific time period, one year, as our experiment, with the sample space being our two possible events: occurrence or non-occurrence. We can refer to the disaster occurring as event \(A\), and non-occurrence as event \(A_c\). We communicate the probability of an event happening using a capital \(P\), so the probability of \(A\) occurring is \(P(A)\).
Note: \(A_c\) is the complement of \(A\) (sometimes called “not \(A\)”), and it follows from the axioms of probability that \(P(A_c)= 1-P(A)\). Sometimes other notation is used, for example, \(\bar{A}\), which is read out as “\(A\) bar”.
This will be described in more detail below.
Often it’s useful to draw the events and sample space like this:
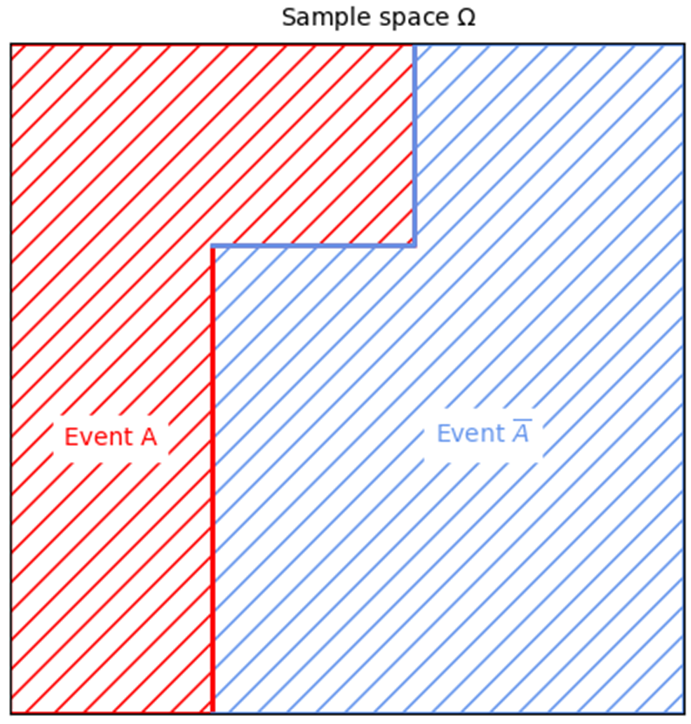
We can see our sample space is represented by the outline of the diagram, which also represents a probability of 1.0. The sample space has also been divided into two parts, and since the entire area is filled with \(A\) and the complement of \(A\) (\(\bar{A}\)), we know that these are the only two possible outcomes. Remember Venn diagrams from your high school statistics course? There was often an overlap area between the two circles…but in the figure here that’s not the case. Do you know why? We’ll cover that in the next part of this module! But first, some simple questions about the sample space and events considered in the figure:
Quiz#
Mutually exclusive events#
These characteristics tell us very important information about how we quantify the probability of each event we want to consider in our sample space. In this case, whether or not a natural disaster occurs.
Two events are mutually exclusive when the occurrence of one event excludes the occurrence of another. This means that none of the points included in the event \(A\) is included in the event \(B\), and the other way around.
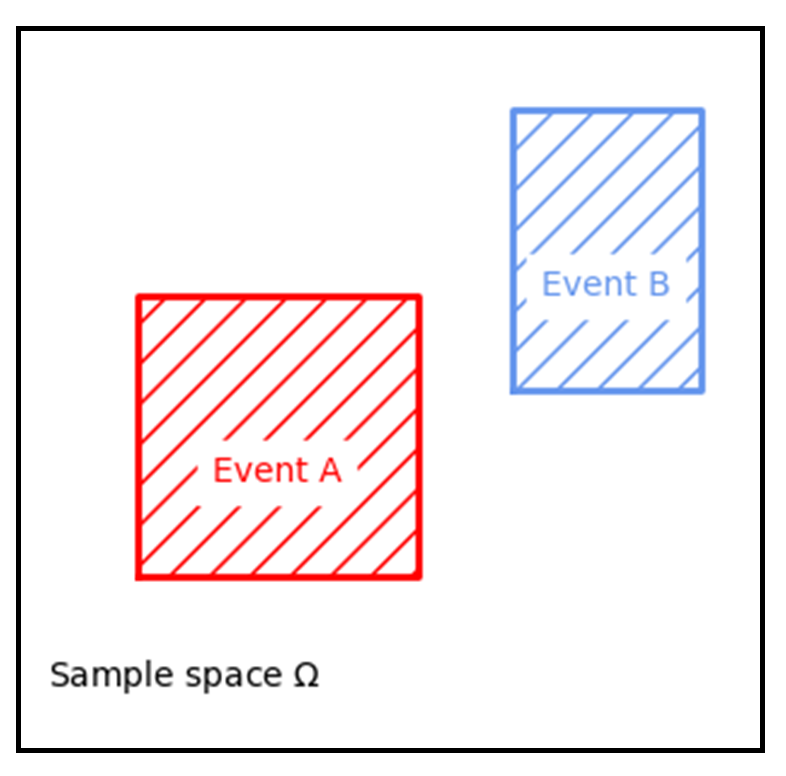
Do you notice anything else interesting about this figure, especially regarding the probability of (A) and (B) and characteristics about these two events within the bigger picture (i.e., the sample space)?
Quiz#
Collectively exhaustive events#
Two events are collectively exhaustive if at least one of them occurs whenever the experiment is performed. This can be illustrated by the previous set of figures, where the one with \(A\) and \(\bar{A}\) are collectively exhaustive because they fill up the entire sample space. In contrast, the figure with events \(A\) and \(B\) left a blank, unlabeled area in the sample space (the probability that nothing happens). This may seem simple and obvious now, but it has important implications when making probability calculations, which you will see in other modules (for example, the total probability rule). In addition, the union of collectively exhaustive events constitutes the sample space of that experiment. We will see the formal concept of union a bit later. For now, just know that the union is represented by the total area covered by our set of events, in this case, \(A\) and \(\bar{A}\), and that the probability of the union is equal to 1.0
Let’s consider whether or not an earthquake will occur during a one year period. Because there are only two possible outcomes (a binary event), \(A\) and \(\bar{A}\) are collectively exhaustive.
Quiz#
Mutually exclusive and Collectively exhaustive events#
In all of our CEG applications, we need to use our knowledge of the system or process to confirm whether or not events are collectively exhaustive. Let’s try it!
Quiz#
Consider whether or not a typhoon occurs during the storm season in the southeast Pacific Ocean:
Consider whether or not critical infrastructure on an island in the southeast Pacific Ocean is damaged during the storm season:
Consider the intensity category of a typhoon in the southeast Pacific Ocean.
Now consider two events, \(A\): a typhoon occurs in the southeast Pacific Ocean during the storm season, and \(B\): critical infrastructure on an island in the southeast Pacific Ocean is damaged during the storm season:
Non Binary events#
Note that we chose to define the natural disaster as binary, but this is not always useful. Sometimes we are interested in the number of events per year, or perhaps a discrete or continuous representation of the event, for example, earthquake magnitude as a continuous random variable, or severity of droughts as a discrete variable (e.g., the intensity measured as mild, moderate, or severe). We will consider these cases in other modules of the course.
Let’s explore this more with a new example!
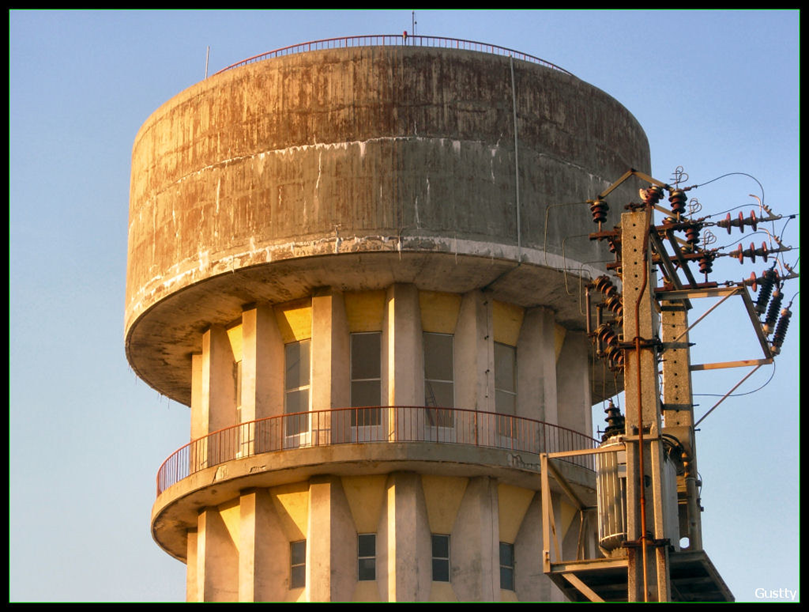
Imagine a water supply system for a town that has two water tower reservoirs, Tower A and Tower B. We want to make sure that there is enough water in the reservoirs to supply the town with fresh water. In a broader sense, we know that these towers are part of a larger water distribution network, so we are really interested in the chance that the towers can provide sufficient water or not, since this information can be used to design and build the rest of the water system in a reliable and resilient way. So, with that in mind, there are several ways we can define the volume of water stored in a reservoir:
a) Either full or empty.
b) Partially filled, measured as empty, ¼, ½, ¾, full.
c) Partially filled, measured as a number from 0 to the maximum volume v.
Option a would define the volume of water as a) binary variable since only two options would be possible. Option b) would define it as a discrete variable since the volume would be defined in a countable subset of the real numbers. Finally, option c) would model volume as a continuous variable, since it would define the variable in an uncountable subset of the real numbers.
We will see more examples of non-binary events later. For now, we will focus on binary and discrete cases (cases a) and (cases b).
Intersection (AND) and Union (OR)#
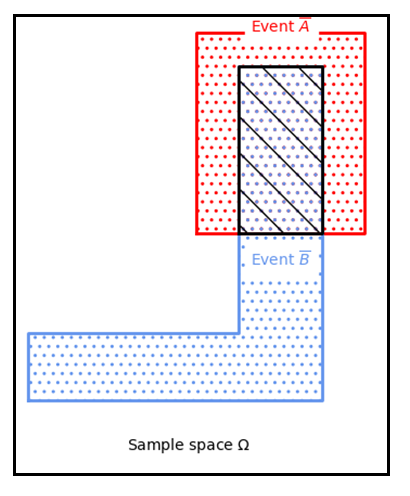
As previously introduced, we have a water supply system for a town with two water tower reservoirs, Tower A and Tower B. We can define the event that Tower A is full (event \(A\)) or empty (\(\bar{A}\))). We can define the same events for Tower B (full, \(B\)), and empty, \(\bar{B}\)). Let’s represent them graphically.
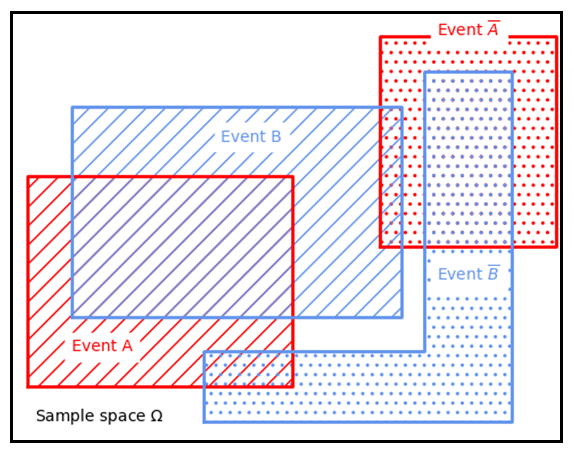
As you can see, there is an overlap between \(A\) and \(B\), between \(A\) and \(\bar{B}\) and between \(\bar{A}\) and \(B\). Remember that there is no overlap between \(A\) and \(\bar{A}\) and between \(B\) and \(\bar{B}\)because they are mutually exclusive (towers cannot be empty and full at the same time!).
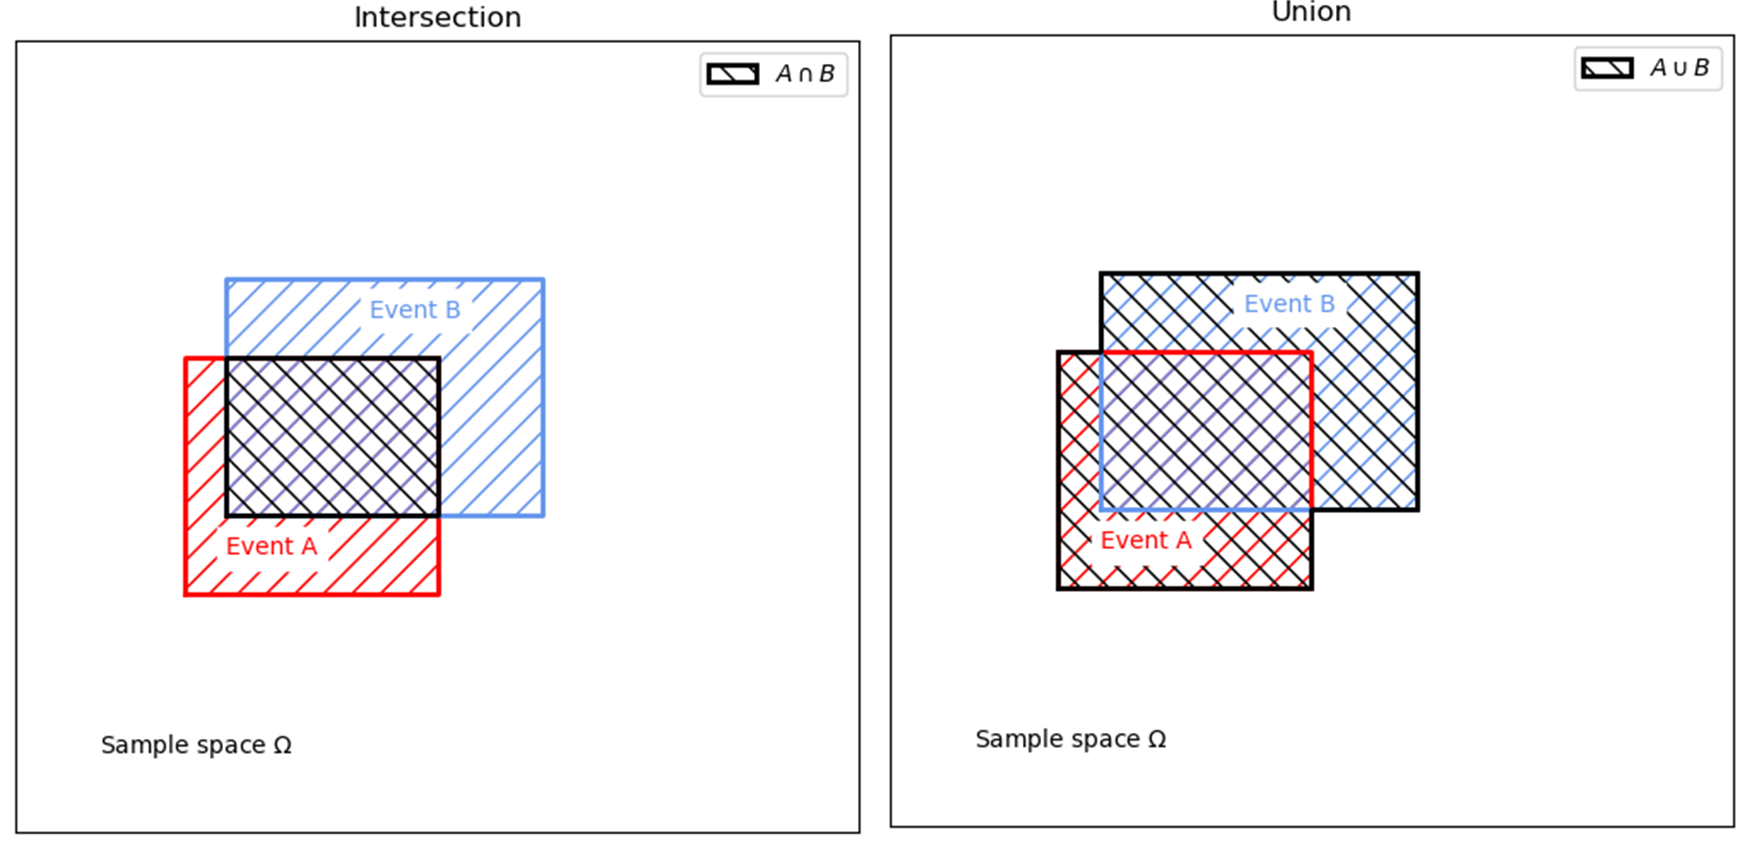
The intersection of two events, \(A\) and \(B\), is constituted by the common points between the two events and it is denoted as \(AB\) or \(A \cap B \). Thus, it is called the AND operator (the area where both \(A\) and \(B\) occur).
The overlap areas between \(A\) and \(B\), and between \(\bar{A}\) and \(\bar{B}\) are much wider. In other words, it is highly probable that Tower A and Tower B are full or empty at the same time. This is important since we might think that we are building redundancy by having two towers, but if both are empty at the same time, it’s not as effective!
However, the capacity of one of the towers may be enough to supply the needed water. In that case, we would not be interested in both towers being full at the same time, but at least having one of them full. That is the union, which represents the joint or common occurrence of two events, and it is denoted as \(A+B\) or \(A \cup B \). Thus, it is called OR operator (the area where \(A\) or \(B\) occurs). In the figure below, it is shown the graphical representation of \(A \cap B \) and \(A \cup B \).
Let’s consider whether or not an earthquake will occur during a one year period. Because there are only two possible outcomes (a binary event), \(A\) and \(\bar{A}\) are collectively exhaustive.
Solar panels#
Let’s test what you have learned about intersections and union!
Imagine we are planning to build a small solar panel facility to make more sustainable energy consumption in a domestic facility. Our solar panel facility is composed of 16 solar panels.

Once it is in operation, we will be able to reduce the amount of energy produced obtained from external sources. Consequently, we want to estimate the amount of time we will be able to cover the energy needs with our solar facility.
Assuming that we need all 16 solar panels working at the same time to fulfil our energetic needs:
Water towers reservoirs#
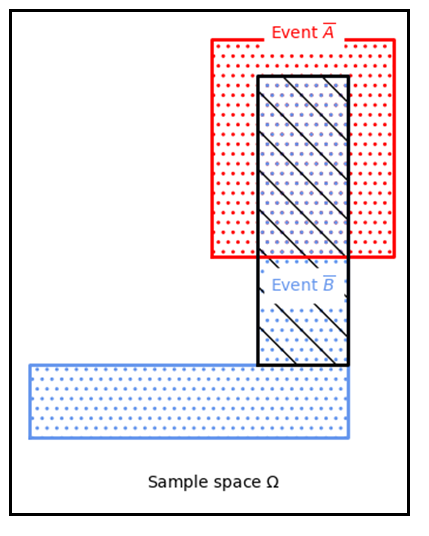
Let’s go back to our previous example of the water tower reservoirs. Now, we will focus on the events where there is no water in the towers (\(\bar{A}\) and \(\bar{B}\)).

Question 1
Question 2
Axioms#
Let’s talk quickly about axioms
As you may remember from a previous course on probability and statistics, there are some basic statements that always hold when talking about probability. They are called axioms! You can easily find out more details with a quick internet search, so let’s quickly review a few key points.
The first two axioms tell us that probabilities can take values from 0 to 1, with the probability of the whole sample space equal to 1.
\( 0 \leq P(A) \leq 1\)
\(P(\Omega) = 1\)
Based on the previous discussion in this module we can see that if two events are mutually exclusive, the following holds:
\(P(A \cup B) = P(A) + P(B) \)
This is the third axiom of probability! Remember that two events being mutually exclusive means that the occurrence of one event excludes the other, so they do not have points in common in the Venn diagrams. However, if they do have points in common, we need to subtract that area. Mathematically, that looks like this:
\(P(A \cup B) = P(A) + P(B) - P(A \cap B)\)
The axioms of probability may seem simple, but they are incredibly powerful because they support a number of mathematical rules as well as allowing us to represent all sorts of physical phenomenon, which we will see throughout this course and those that follow. One quick example is how we can combine the second and third axioms of probability to prove that if two events are collectively exhaustive their union represents the entire sample space, and the probability of the union is therefore 1.0. In our earthquake example, this means that the probability of the earthquake happening or not happening is 1.0.
Independence#
Do you remember our example of the two reservoir towers? Tower A and Tower B were built to ensure the water supply system has sufficient capacity. We defined the event that Tower A is full (event \(A\)) or empty (\(\bar{A}\)), and similarly for Tower B (full, \(B\) and empty, \(\bar{B}\)).
We want to make sure that there is enough water to meet the water demand in the town. That is why we installed two reservoirs, although most of the time if there is an average amount of rainfall, the system will have enough water with only one tower. It seems reasonable to assume that building two towers is good enough, right?
What we have not considered previously is the relationship between events \(A\) and \(B\). During a drought, it is more likely that both reservoirs are empty, whereas during a rainy year it is more likely that both reservoirs are full. In other words, a dependency exists between \(A\) and \(B\), since there are common drivers which influence whether or not the reservoirs are full or empty.
This is extremely important when assessing our system. If we do not consider this dependence, we may think that we are building a redundant system. However, since the amount of water in one tower is closely related to the other, we are not being effective, and the system capacity may be on the unsafe side! In terms of probability, we see that if Tower A is empty, the probability that Tower B is empty is higher than what we might think if we didn’t know about the condition of Tower A. The converse is also true. You will soon see that we can actually calculate this change in probability using our Venn diagrams and with the mathematics of probability, but first, we need a definition of independence.
Two events are (stochastically or statistically) independent when the probability of occurrence of one of the events is not affected by the occurrence of another event. Conversely, if the probability of one event takes on a different value given the outcome of another event, they are dependent.